Want more income, jobs, and creative workers? Get as many people as possible to use fast affordable Internet connections: that’s the result of a nationwide detailed study. Adoption matters more than availability, and speed matters for creative workers.
 Broadband’s Contribution to Economic Health in Rural Areas: A Causal Analysis
Brian Whitacre, Oklahoma State University; Roberto Gallardo, Mississippi State University; Sharon Strover, University of Texas at Austin,
presented at the Telecommunications Policy Research Conference,
September 2013.
Conclusion and Policy Implications
This research yields important findings on the effect of broadband on economic gains, namely on household income and employment levels. The ability to do matched county comparisons, specifically in non-metro counties, demonstrates the influence of adoption (as opposed to availability) in producing these positive outcomes, and constitutes another indication that development efforts should focus on mobilizing populations to subscribe to and use broadband capabilities. Again, cultivating local leadership, mobilizing the services of cooperative extension educators nationwide, and working more closely with each State Broadband Initiative could be fruitful avenues for targeting adoption.
We’re in a fertile field for economic improvement this way:
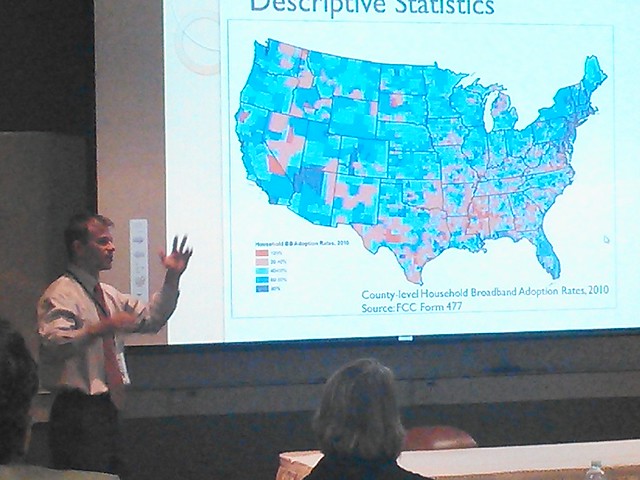
Figure 1 displays the 2010 FCC adoption data from a geographic perspective. Several states exhibit low levels of adoption, notably those in the South (Georgia, Mississippi, and parts of Louisiana, Texas, and Oklahoma). Very high levels of broadband adoption exist in the Northeast, and also near Denver in Colorado. Interestingly, most states have pockets of counties with high levels of adoption, and there does appear to be a general spatial trend among the data. Many of the counties with low levels of adoption are lightly populated and have lower income levels. In fact, the average county population in 2010 for counties with the lowest adoption levels is 11,760 (compared to the national average of 25,020 for all non-metro counties). Similarly, the average median household income level in these counties is $34,500 compared to $39,500 for all non-metro counties.
The Valdosta MSA is part of this study.
The really interesting part to me is that what matters most is not business adoption of broadband: it’s adoption by the general population. See page 16:
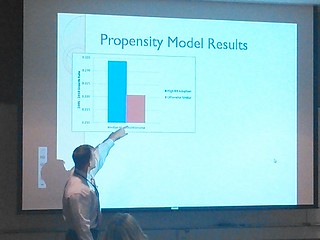
The results suggest that, generally, broadband adoption, availability, and download speed do have meaningful impacts on growth rates of economic health measures in non-metropolitan counties. In particular, non-metro counties that demonstrated high levels of broadband adoption (defined as county-level adoption rates >60%) had significantly higher levels of growth in median household income and significantly reduced levels of unemployment when compared 16with otherwise similar counties that did not meet this threshold. Alternatively, low levels of broadband adoption (<40%) imply detrimental impacts for rural businesses, with low-adoption counties having firm and employment growth rates approximately 3 percentage points lower when compared to their matched counterparts.
This is not just correlation: they’re talking causality, with evidence for it; see page 4:
In general, the studies related to broadband and rural economic development are limited. Most analysis related to broadband and economic outcomes are focused on aggregate or urban measures, with investigations specific to rural typically being more anecdotal or hypothetical. This paper seeks to address this shortfall and provide empirical evidence of a causal relationship between broadband availability / adoption and economic growth in rural areas.
 Co-author Prof. Sharon Strover of UT Austin is one of the most
experienced and savvy researchers in this field (that’s the back of her head
in the picture).
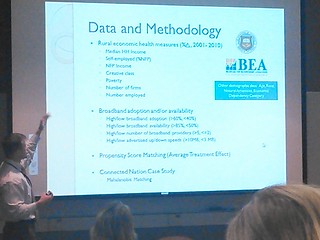
The study uses multiple data sources and meshes them together
with rigorous statistical analysis to get some results.
Surprisingly, it doesn’t correlate with number of local providers. So it’s not about getting new providers in. The only new entrant we’re likely to see is Softbank + Sprint + Clearwire, or maybe Google fiber, unless somebody does a municipal network. It’s about getting the incumbents to get off their low-and-slow duff and provide real speeds and coverage for affordable prices.
On page 6 the researchers say what they mean by broadband:
The FCC data also include information on two distinct speed thresholds for “broadband” — one defined under the traditional measure of at least one direction with 200kbps, and another under a faster definition of 768kbps download, 200kbps upload.5
5 This speed (768 kbps down, 200 kbps up) was adopted by the FCC at one point as a definition for broadband, and BTOP likewise used it for reporting purposes. The most current broadband speed definition the FCC uses is 4 Mbps for download and 1 Mbps upload.”
They didn’t include wireless because it’s not in the datasets they were using. They’re aware of its current value and potential; same page:
“It is worth noting that this primary variable of interest deals with residential fixed (wireline) broadband connections — therefore, wireless or phone connections are not included.”
Locally, AT&T has already been bragging about investing $675 million in Georgia networks including wireless. We’ll see how much that translates into fast affordable service coverage, given that AT&T still doesn’t have as good coverage at Verizon,.
Availability also does matter, just not as much and not as firmly established; see page 17:
Broadband availability thresholds also demonstrate some (potentially causal) relationships with economic health, although the results are somewhat counterintuitive. Non-metro counties with high levels of broadband availability (>85%) had growth rates of non-farm proprietors income that were over 5 percentage points lower than comparable counties with lower levels of availability. This suggests that high levels of availability are actually causing non-farm proprietor income to decline — perhaps suggesting that non-farm proprietors in these areas are not taking advantage of higher levels of availability. If residents have high levels of availability, they may expect most businesses they deal with (including the self-employed) to offer online payment options or have a viable web presence. Entrepreneurs who do not offer these elements might find their incomes declining. Table 4 also demonstrates that non-metro counties with low levels of broadband availability (<50%) had growth rates of median household
income that were marginally higher than otherwise similar counties. Although this result is counterintuitive, recall that the treated and non-treated groups are matched based on their probabilities of reaching the broadband threshold — in this case, having very poor broadband availability. Counties with high likelihoods of having such poor levels of infrastructure likely have low population densities, and relatively low income and education levels. Changes to median household income over a 10-year period can be driven by any number of factors, including returns to those residents that do have access to (and productively use) broadband.
It’s not just any old availability. Speed matters; see page 18:
In terms of broadband download speeds, attaining a high threshold (>10 Mpbs) appears to be causally linked to higher increases in the percentage of employees classified as creative class workers. Although the difference between treated and control groups was less than 1 percentage point in this case, many rural communities are actively seeking to attract creative class workers, and these results indicate that having high download speeds available plays a role. Poverty levels were also roughly 2.6 percentage points lower in non-metro counties with high download speeds compared to otherwise similar counties, suggesting that broadband speed can be an important contributor to general community well-being.
You can get work done at lower speeds:

Finally, having only low levels of average download speeds (< 3Mbps) is associated with marginally higher growth rates in median household income. This counterintuitive result may suggest that many productive uses of broadband can still be accomplished at lower speeds.
But if you want “creative class workers”, or what our local Chamber has called “knowledge-based workers”, you want fast speeds; see also page 23:
A particularly interesting result is that achieving high levels of download speed in non-metropolitan counties does seem to have the desired result of attracting creative class workers and lowering poverty levels. This suggests that while promoting adoption should be the first and foremost goal, achieving higher levels of speed in rural areas is also a worthy policy premise. In the future, case studies on very high speed networks such as those in Chattanooga and Kansas City may also be warranted given that most (76%) of economic development professionals in a recent survey felt that speeds of 100 Mbps or greater were needed to effectively attract new businesses (Settles, 2012). The recent growth of fiber networks in rural portions of the country (many funded by the American Recovery and Reinvestment Act) will also provide an opportunity for studies related to economic growth.
And I can attest that if you want lots of local video bloggers, you want fast upload, too. Imagine if everybody could post their own view of the local football games….
Once again what matters most for economic health is not just availability: it’s adoption by the general public. Not just business adoption: adoption by the general public. See page 19:
From a policy standpoint, this suggests a need to focus on increasing adoption rates in order to spur economic growth, and that simply improving levels of infrastructure availability will not necessarily achieve that goal.
So it’s availability + adoption that matters for rural economic health. Oh, and another study indicates possibly also increased house prices.
-jsq
Short Link:


Pingback: U.S. adults fail math, reading, and problem-solving | On the LAKE front