However, there is substantial evidence that low educational performance does increase likelihood of incarceration. Furthermore, parental involvement won’t be enough to deal with this, since low-education prisoners tend to have low-education parents. Hillary was right: it does take a village.
In 1994 far more prisoners had reading difficulties than did the general public:
“Prisoners are more likely than the household population to perform in the lower levels of the three scales (table 2.3). About one in three prison inmates performs in Level 1 on the prose scale, compared with one in five of the household population. About 33 percent of prison inmates and 23 percent of the household population perform in Level 1 on the document scale, and 40 percent of prisoners and 22 percent of household respondents on the quantitative scale. Thus, the differences in percentages performing in Level 1 are 10 for the prose and document scales and 18 for the quantitative scale. … Thus, prisoners consistently demonstrate lower proficiency than the household population on all three scales, whether measured by the distribution of prisoners in the levels of each scale or by their average proficiency scores.”
What do those levels mean?
About a third of prisoners have trouble reading even the simplest text:
“Thirty-one percent of prison inmates perform in Level 1 on the prose literacy scale, 33 percent are in this level on the document scale, and 40 percent on the quantitative scale (table 2.3). This means that approximately 237,000 to 306,000 of 766,000 prison inmates perform in the lowest level on each of the literacy scales. Prison inmates at this level may be able to read short pieces of text to find a single fact, enter personal information on a document, or add numbers that are set up in a column format. Other inmates in Level 1, however, do not demonstrate the ability to perform even these fairly straightforward literacy tasks.”
Another third maybe can find information in a document:
“Performing in Level 2 are about 37 percent of prison inmates on the prose scale, 38 percent on the document scale, and 32 percent on the quantitative scale — about 245,000 to 291,000 prisoners. Prisoners at this level on the prose scale can generally make low-level inferences based on what they read and integrate two or more pieces of information. Those in Level 2 on the document scale can locate a piece of information in a document in which plausible but inexact information is present and can integrate information from various parts of a document. Prisoners in Level 2 on the quantitative scale can correctly add, subtract, multiply, or divide simple numbers found in a text.”
Only about a fifth of prisoners can pull together information from different places in text:
“Between 22 percent and 26 percent of prisoners — about 169,000 to 199,000 prisoners in all — could perform literacy tasks in Level 3. Prisoners in this level on the prose scale could integrate information from relatively long or dense text, and those in this level on the document scale could integrate multiple pieces of information found in documents. Prisoners in Level 3 on the quantitative scale could perform arithmetic operations using two or more numbers found in printed material.”
Only about 1/16 of prisoners can read and understand adult prose:
“About 6 percent of inmates, or about 46,000, could successfully perform Level 4 tasks on the prose scale and, thus, could synthesize information from lengthy or complex passages. Four percent, about 31,000, are in Level 4 on the document scale and are able to make inferences based on text and documents. Six percent perform in Level 4 of the quantitative scale; they can perform sequential arithmetic operations using numbers found in different types of displays.”
And only 1/200 of prisoners were capable of doing the research for this blog entry:
“Less than 0.5 percent of prison inmates perform in Level 5 on the prose and document scales and about 1 percent on the quantitative scale. To perform in Level 5 on the prose scale, one must contrast complex information found in written materials or make high level inferences or search for information in dense text. Level 5 on the document scale requires readers to use specialized knowledge and search complex displays for particular pieces of information. To achieve this level on the quantitative scale, respondents must determine the features of arithmetic problems either by examining text or by using background knowledge and then perform the multiple arithmetic operations required. Very few inmates, 8,000 or fewer, perform in this level.”
The study doesn’t say how many prisoners could write at that level, but it’s safe to say that there aren’t many Malcolm Xes in today’s prison system.
Fewer prisoners reached higher levels of schooling than did the general population:
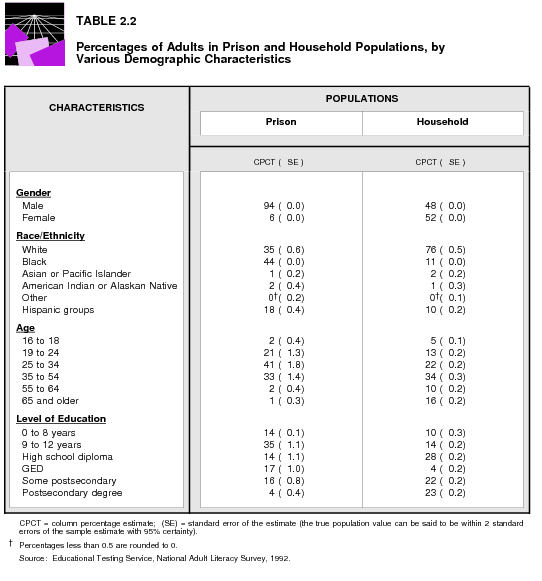
“As shown in table 2.2, the prison population attained lower levels of education than the household population. Greater percentages of prisoners than householders attained less than a high school diploma; 14 percent of prisoners have 0 to 8 years of education, compared with 10 percent of householders, and 35 percent of prisoners have 9 to 12 years of education compared with 14 percent of householders.”…
“About 20 percent of the prison population, compared with 45 percent of the household population, has had some education beyond high school; 49 percent of the prison population, compared with 24 percent of the household population, did not complete either high school or a GED.”
The study doesn’t stop there:
On all three literacy scales, White prisoners demonstrate higher average literacy skills than Black prisoners, who show greater proficiency than Hispanic prisoners (table 2.5). The proficiency scores of White prisoners are, on average, 28 points higher than those of Black prisoners and 62 points higher than scores of Hispanic prisoners on the prose scale; the scores of Black prisoners are 34 points higher than those of Hispanic prisoners. On the document scale, the proficiency scores of White inmates are an average of 38 points higher than the scores of Black inmates, and Black inmates’ scores are 34 points higher than Hispanic inmates’ scores. On the quantitative scale, the proficiency scores of White inmates are 44 points higher on average than those of Black inmates and 66 points higher than those of Hispanic inmates. These differences among inmates mirror differences among adults in the household population, in which the proficiency scores of White adults are 49 to 63 points higher than those of Black adults and the scores of Black adults are 12 to 22 points higher than those of Hispanic adults, on average.White prisoners demonstrate lower proficiencies than White adults in the household population on all three literacy scales. On average, their prose proficiency is 16 points lower, their document proficiency 10 points lower, and their quantitative 20 points lower than the proficiencies of the White household population. On the other hand, the proficiency scores of Black and Hispanic prisoners tend to be about the same as those of their counterparts in the household population. The exception occurs among Hispanic adults on the document scale, where prisoners demonstrate lower average proficiency than adults in households (198 compared with 213, respectively).
The study reported regression analysis for sex, race, age, and education between the prison and outside populations:
When the variables are held constant, there is no significant statistical difference in performance on all three scales between the prison and the household populations. The characteristic having the most effect on performance is level of education, followed by race/ethnicity. Thus, when comparisons are made between the prison and household populations, it is important to remember that differences in overall performance are most likely attributable to differences in the demographic composition of the two populations. On the other hand, the differences in demographics are important and should not minimize the significance of the overall low performance of the prison population, which comprises many individuals who demonstrate the need for improved literacy skills.So for a given literacy level, prisoners were about as proficient as the outside population. However, far more prisoners are at lower levels of literacy.
The demographic composition and educational attainment of the prison population differ significantly from that of the household population, with the prison population more likely to be male, minority, young, and less educated.So it looks like education would be one good way to keep people, especially young black men, out of prison.
The study notes that prisoners’ parents tend to have lower levels of education than the general population. So parental involvement is good, but probably won’t be not enough to address this problem. Community involvement is also necessary. You can go read to a child.
 This is all in addition to the general problem that
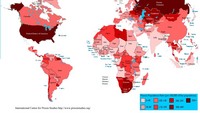
the U.S. locks up more total people and more people per population than any
other country in the world.
44 percent of prisoners reported they were serving time for violent crimes,
26 percent said they were in for drug offenses, and 18 percent for property offenses.
Drug offenders demonstrate lower prose and document proficiencies than property offenders, but about the same quantitative proficiency. Violent offenders also demonstrate lower proficiencies than property offenders on the document scale. The proficiencies of other types of offenders are not statistically different from one another.So instead of locking up drug offenders, how about educate them. And education would probably reduce the number of violent offenders.
The study also says that 2/3 of prisoners take educational or vocational classes, and many prisoners get a GED while in prison, but it would seem a lot less expensive and more effective to educate people instead of locking them up.
Furthermore, community involvement helps:
In addition to working or taking education and vocational classes, prisoners in most cases have the opportunity to join groups while in prison. As shown in table 4.6, 53 percent of prisoners reported joining groups of various types. The three most frequently joined groups are addiction (29 percent), religious (26 percent), and life skills (20 percent) groups. The proficiency scores of prisoners who joined groups are significantly higher than those of nonjoiners on all three scales. In addition, prisoners who are involved in three or more groups (17 percent) demonstrate significantly higher average proficiencies than those who joined only one or two groups, except on the quantitative scale where the most involved prisoners perform about the same as those involved in two groups. When the proficiency scores of those in the various groups are compared with the scores of those who did not join groups, only the proficiencies of those in religious groups are not significantly higher on all three scales. When proficiencies among the various groups are compared, generally prisoners demonstrate about the same proficiencies on the three scales, regardless of the type of group joined.Education needs to be a community experience.
Source: Literacy Behind Prison Walls, Profiles of the Prison Population from the National Adult Literacy Survey, published by National Center for Education Statistics, Institute for Education Sciences, U.S. Department of Education, October 1994. Another survey was taken in 2003, and was supposed to be released in 2006. That second study would permit examination of effects of education on prisoners over time.
However, we already know that education can help prevent incarceration.
Short Link:

